This DMO compared that year's visitation of a popular festival to the prior year and noted the differences
Contents:
-
What is the distribution of locals vs tourists to this festival?
-
What actionable insights did the client gather from this case study?
- About the Author

Background on Project
This client analyzed and compared visitation to Columbus, OH during a festival weekend. The main goal was to discover the distribution of locals vs tourists to the city that may be attracted by the festival, along with any additional insights on those tourists.
-png.png)
Use Case Questions:
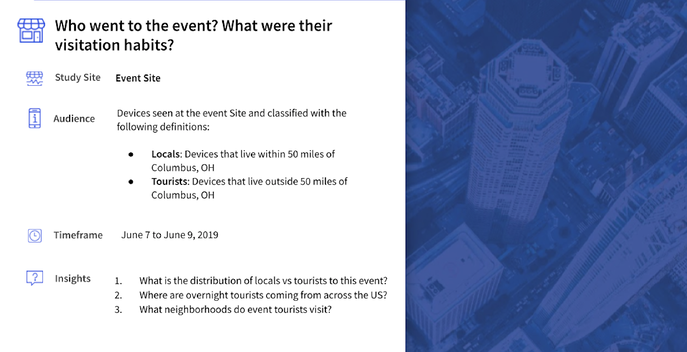
Tourist Definition:
-png.png)
Reports used:
- Common Evening Location - Common Daytime Location Distance Report (CEL-CDL Distance Report)
- Tourist Origin Market and Duration Report
- Aggregated Device History with Context Report
The Tourist Origin Market and Duration Report is not present in Near's Vista platform, but is available for purchase. Please contact us for more information.
What is the distribution of locals vs tourists to this festival?
The CEL-CDL Distance report is a versatile report that can be used to tell you about the people that visit your study location. The report has a column right out of the box that determines how far a person lives and works from the study location, so determining residents and tourists is a simple process.
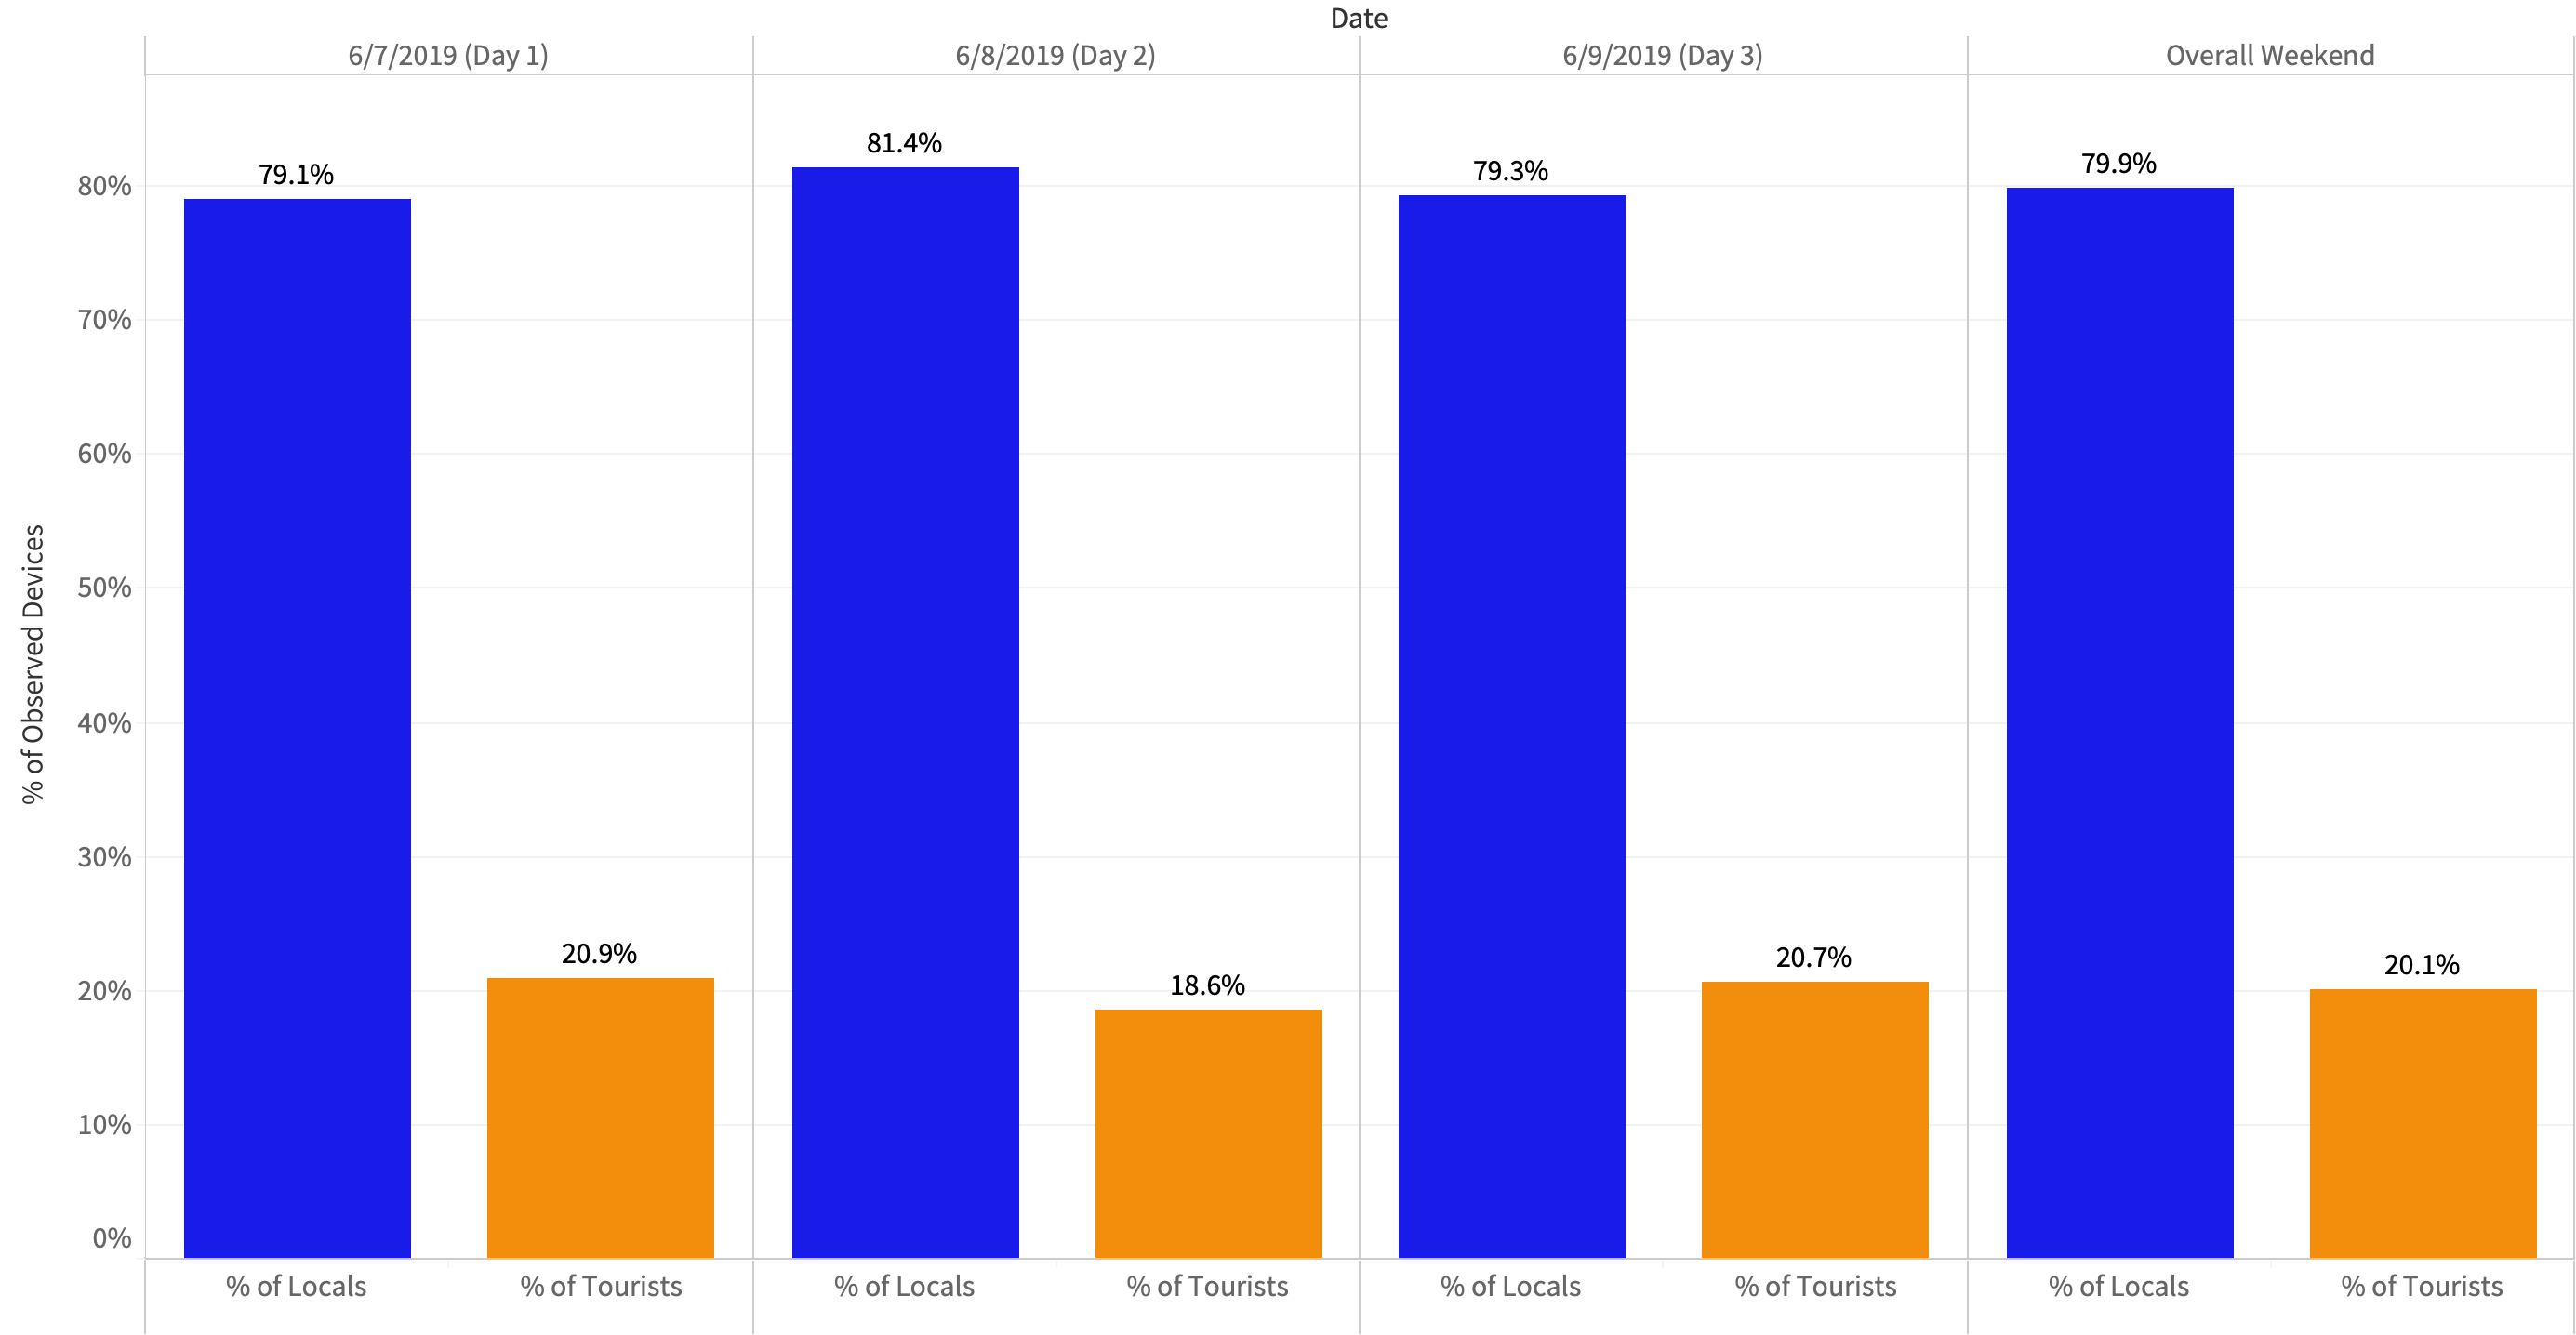
Classifying devices from the CEL-CDL Distance Report based on their distance from the study location allows for visualizations like the one above. From the data, we see that the festival attracted individuals that lived close to Columbus. The trend across the weekend was very similar, where no one day had a large swing one way or the other.
Where are overnight tourists coming from across the US?
The Tourist Origin Market and Duration enables us to look further into the behavior of tourist devices such as their length of stay and whether their trip was a daytrip or an overnight stay. The report also identifies origin markets of where the device is coming from. In this case study, we were interested only in domestic tourists that stayed overnight.
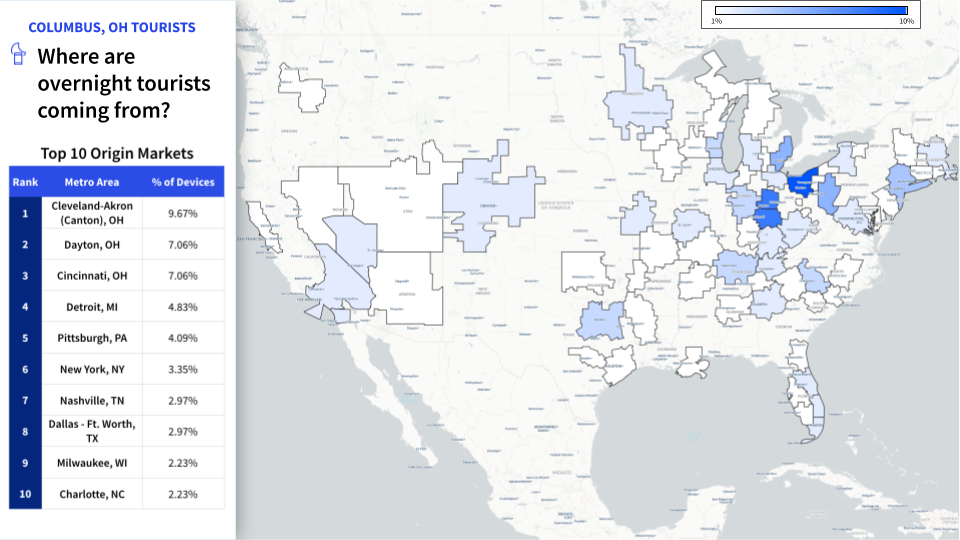
What we saw is that the majority of overnight tourists seen in Columbus throughout the weekend are from Ohio, making up almost a quarter of all domestic devices. Although there was some draw from the west coast, the majority of tourists were from the east.
What neighborhoods do tourists visit?
We can also study where tourist devices also visit throughout the time period with the Aggregated Device History with Context Report. This particular report is best suited to summarize where devices visit without the need for additional data that the normal Device History report outputs. The aggregated report also allows for the implementation of custom polygons so that you can customize your analysis. This case study used 5 custom polygons that outline specific neighborhoods across Columbus as seen below.
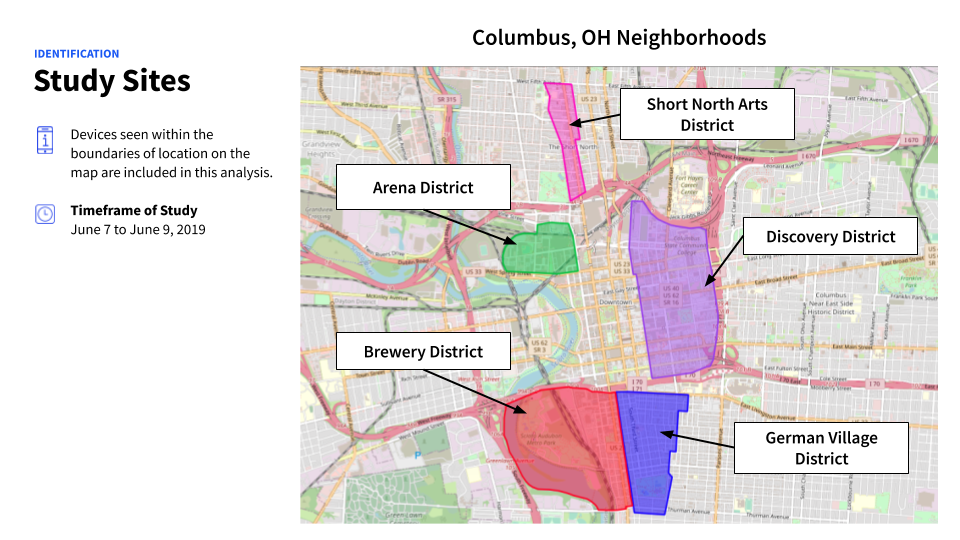
Using the report with these custom polygons, we are able to track how often tourists were seen at each of these districts during the time period.
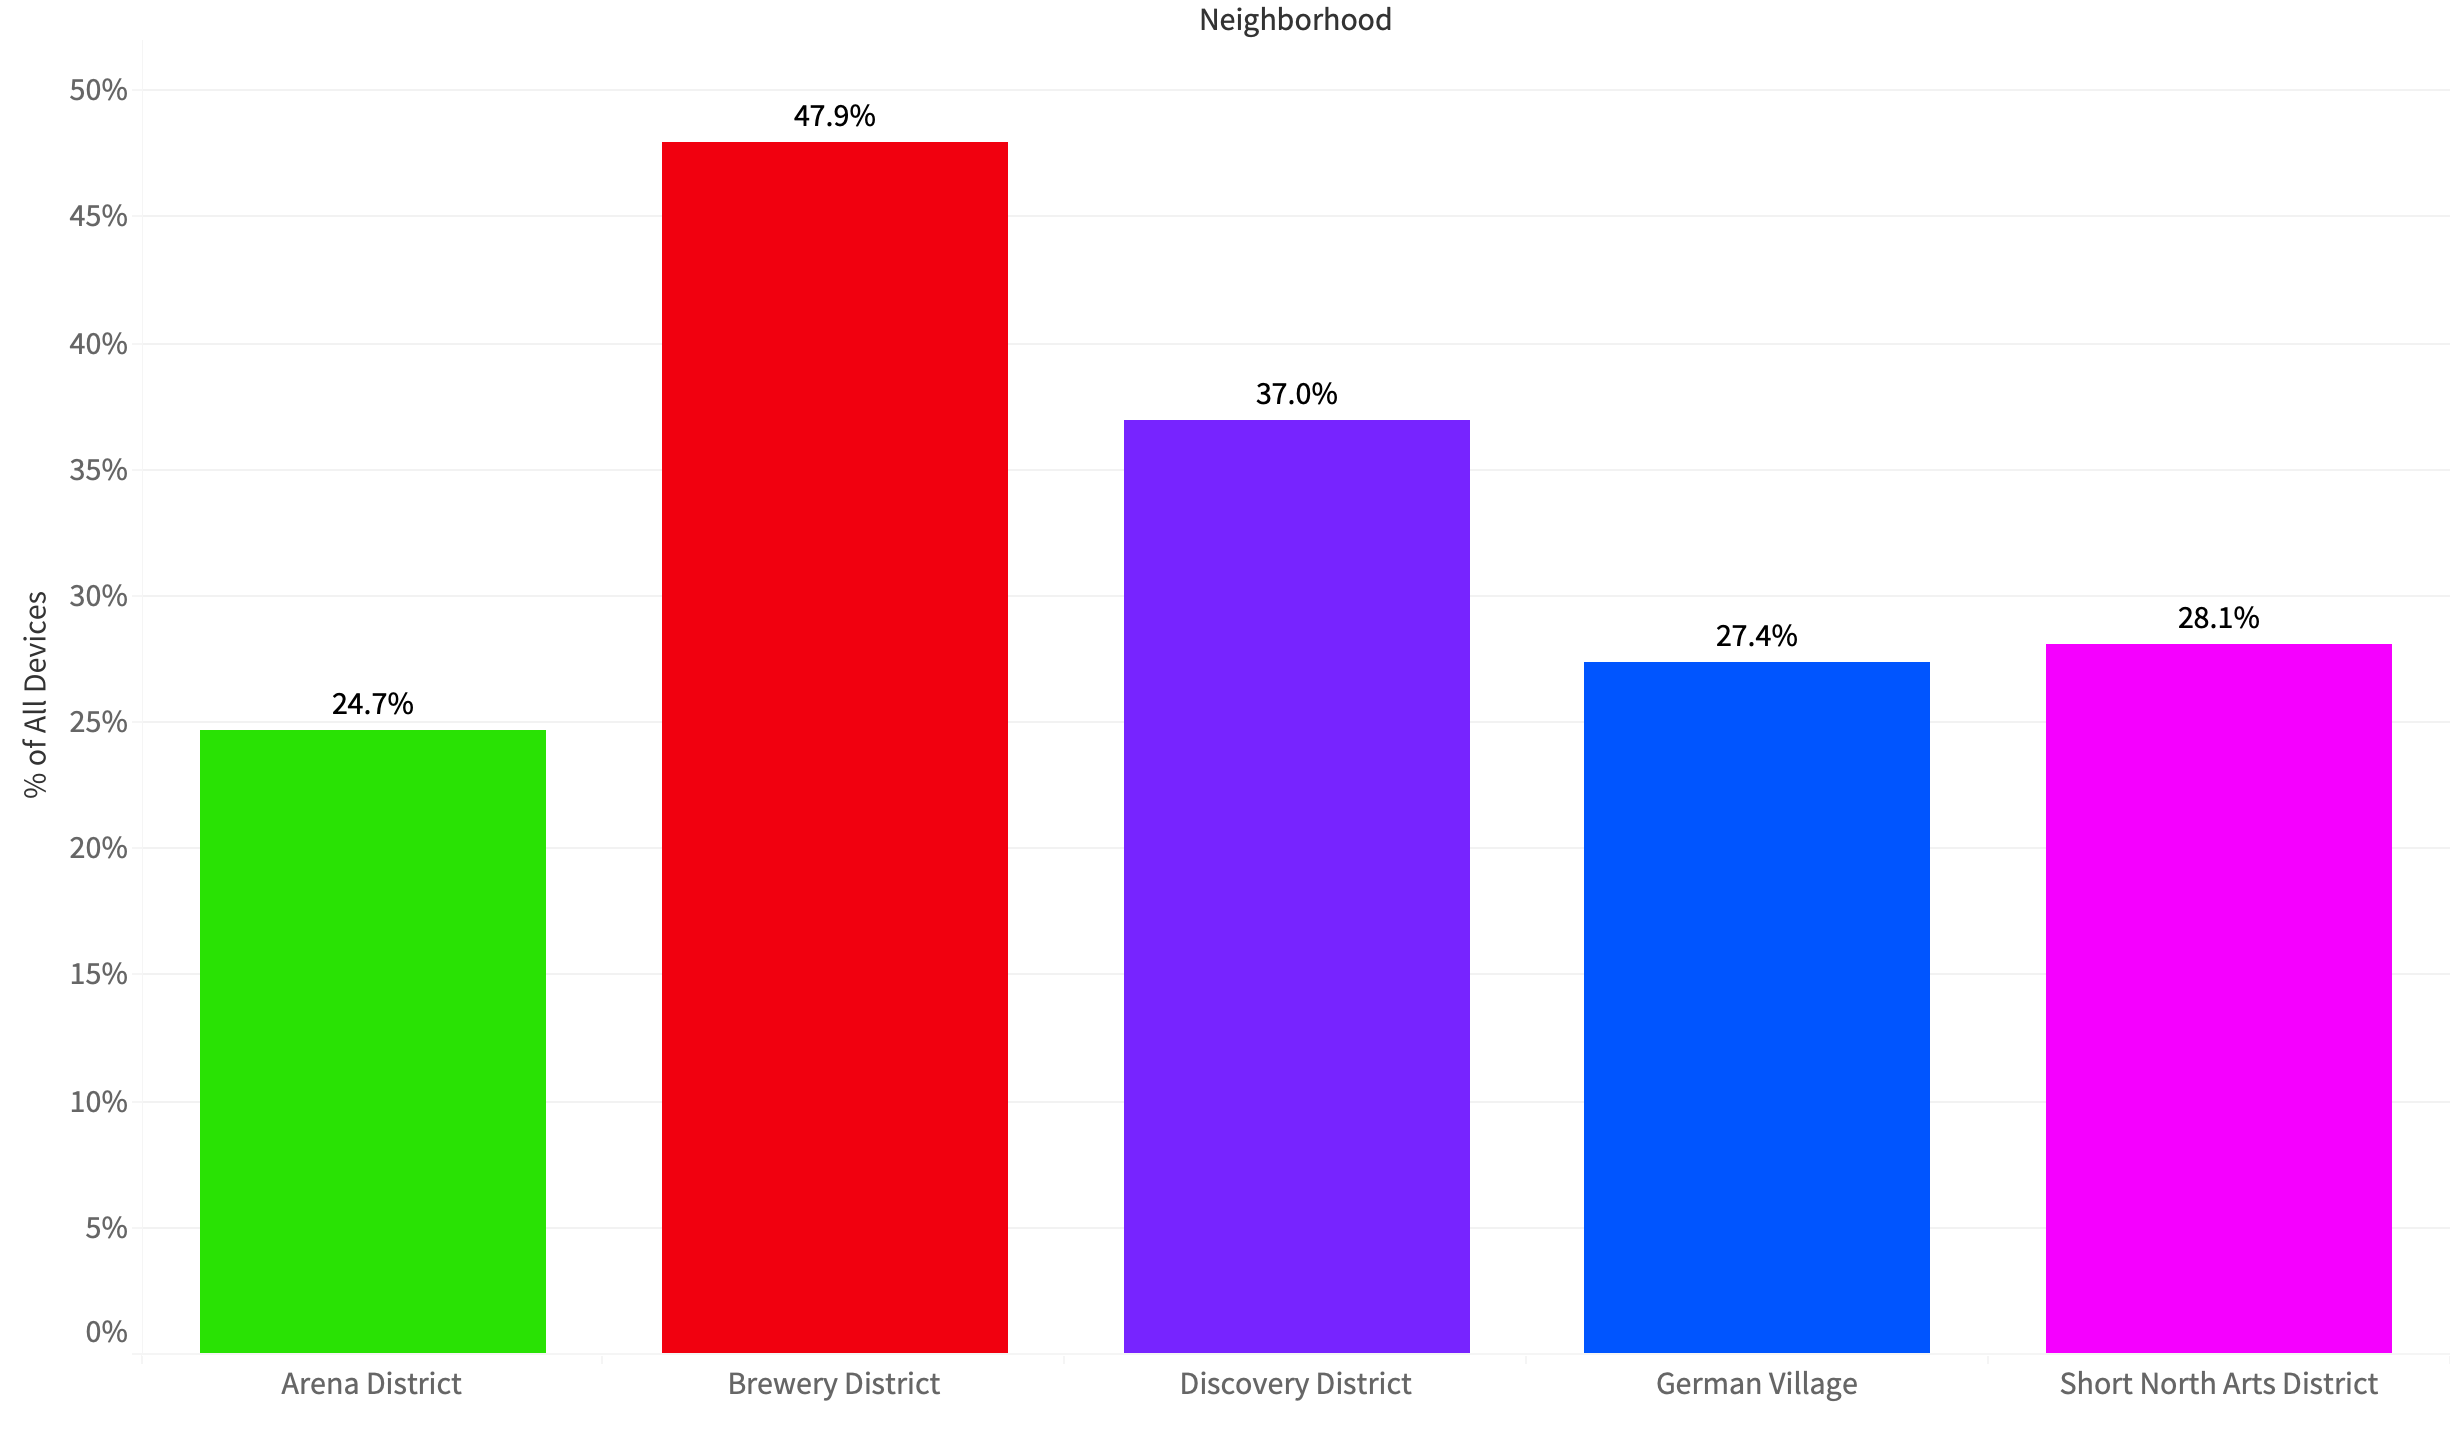
From all of the tourist devices seen throughout the weekend, it seems like the Brewery District was the most popular. This location is associated with a variety of breweries, restaurants, shops, and historical sites with would attract plenty of tourists. These tourists also visited other neighborhoods, where the German Village, Short North Arts District, and Arena District had similar visitation rates.
What Actionable Insights Did the Client Gather from this Case study?
Using the data and insights provided by the above analysis, the client was able to understand the demographics of visitors to their market area and where these visitors tend to travel. With this knowledge, the client was able to focus marketing efforts towards attracting their target audiences and help the city prepare for an influx of visitors to specific neighborhoods. Near data can be used not only for specific festivals but can also be used for other events such as busy holiday weekends. This is just one of many examples that highlight the power of Human Movement Data to guide decisions.
Insights provided by Near in this study are aggregated and de-identified, not tied to any single device or individual. Near adheres to GDPR and CCPA and has been certified for privacy compliance by Verasafe, an independent third party.
About the Author
Raul is Near's in-house Tableau and ESRI expert with background in microbiology. He is passionate about using science and art to craft stories that excite and inspire, and wants to help you do the same.