In this article, we’ll discuss how Near's Human Movement Data can be used to conduct comparative analysis between two different locations.
For as long as there have been businesses, there have been consistent location and performance questions facing business owners. Questions such as “How is my location performing compared to my competitor’s location?”, “What is my customer profile?”, and “Where should I expand to?” Mobile location data is the latest breakthrough in answering these questions.
In this article, we’ll discuss how Human Movement Data can be used to conduct comparative analysis between two different locations, whether those locations are coffee shops, shopping centers, restaurants, or any other retailer.
Step 1: Discover Your Visitors
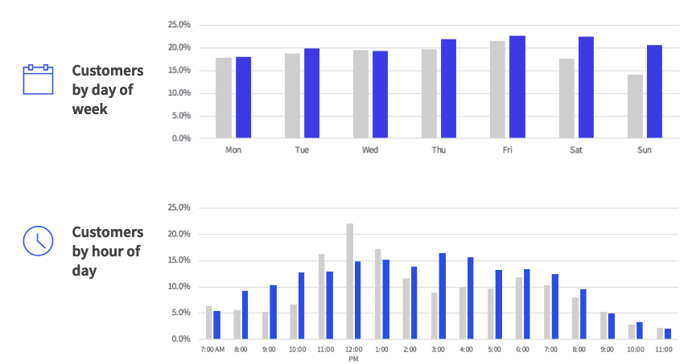
Outline the geography of your store, as well as that of your competitors’, and get a data set of the time/day of visits to your location and your competitors’, as well as the IDs of those visitors. This cut of the data can be used to answer the following questions for each location(s) analyzed:
-
What times of day are busiest?
-
How many unique visitors did I see during the time period of the results?
-
How many visits did the observed visitors make?
-
What days of the week are the busiest?
-
What areas of my location are the busiest (most relevant for malls/shopping centers)?
📍Recreate this using Vista's reports: Zero Point, Visitor Count, and Pin
Example of comparing visitation patterns between two sites:
Step 2: Evaluate Trends Over Time
Understanding how your footfall compares to your competitors over time is a valuable way of understanding the health of your brand. By creating a trend line of visitation, you can evaluate how your store is performing compared to your competitors. This cut of the data can be used to answer the following questions for each location(s) analyzed:
-
Have re-merchandising efforts impacted footfall?
-
Have new location openings cannibalized footfall trends of preexisting locations?
-
Is your competitor experiencing the same growth as you are?
*Note that the size of many datasets from vendors have significantly grown over time. This could throw off an analysis by falsely showing an increase in visits as the dataset itself is increasing . Check with your provider to see if they have developed a baselining methodology, or create one of your own, to control for the growth of data over time. Near has accounted for this and recommends use of our Heartbeat report.
Step 3: Discover Where Visitors Work and Live
Understanding where visitors to a location live and work is a critical piece of creating marketing plans, as well as understanding draw areas and visitor demographics. Check with your vendor if they provide home and work locations for visitors. If not, with enough data, these locations can be derived using a frequency methodology (or one of your own devising).
These types of data can be used to answer the following questions for each location(s) analyzed:
-
Where do customers live?
-
Where do customers work?
-
Do the locations attract close-by workers or close-by residents or both/neither?
-
What Zip Codes/census block groups drive the most visitors?
-
Which Zip Codes/census block groups are weak in terms of driving visitors?
-
How far do visitors travel to visit the location? Are visitors primarily walking or driving to the location?
-
Do any sites have a higher than expected loyalty factor? Do customers expected to visit a particular site instead choose to travel further and go to a different location?
📍Vista's Common Evening Location and Common Daytime Location reports can get you to these insights quickly!
Step 4: Discover How Visitors Get to Locations (Pathing)
Another area to examine is how customers travel to and from the study locations. For this, look at the visitor IDs for a period of time before and after their visit timestamp. The period of time should be appropriate for your vertical. For example, a 15 minute drive time for a fast food restaurant vs. one hour for a big box specialty store.
A Pathing dataset which follows visitors on their way to and from your location can be a useful tool in your toolkit. To create a pathing dataset, look for the set of points before/after a device enters your store for the timeframe you wish to analyze. This type of analysis/report can be used to answer the following questions for each location(s) analyzed:
-
What roads/pathways do customers take to get to the location?
-
Where do customers stop on the way to/from the locations?
-
Are customers coming directly from home/work locations? Is their trip to the location purposeful or part of a larger shopping trip?
One word of caution. For many vendors, the history of all visitor devices over a long period of time can be a substantial amount of points. This may cause problems with map rendering in all but the most sophisticated GIS systems due to the file size and sheer volume of points.
Step 5: Compare Trade Areas
A trade area is the geographic area from which a location generates the majority of its customers. Human Movement Data is a new input into traditional trade area modeling. This can help provide data on actual draw locations as opposed to theoretical ones relied upon in the past.
Using both pathing data and home data discussed in the previous sections, remove the 25-30% of data furthest from the location and map the remaining 70-75%. The area that encloses these points comprises the area from which your location draws the most visitors.
Comparing the trade area of your location with the trade area of your competitor can help evaluate:
-
Do draw areas overlap? How much are you pulling customers from the same areas as your competitor?
-
Are draw areas shrinking over time?
-
What impact has any marketing effort in the weak areas had?
-
Which locations are candidates for expansion?
While trade areas can be excellent for analyzing the larger market forces, this type of analysis doesn’t make sense for locations which have extremely large draw areas (examples include hotels and tourist attractions).
Trade areas are fundamentally a visual construct, so mapping the trade areas is critical to perform this analysis.
📍Near's Optimal GeoSpace report has flexible settings and can quickly produce a trade area file for you to use in your preferred GIS software.
Step 6: Profile Your Visitors
Understanding the differences between your visitors and your competitors’ visitors can add another dimension to your comparative analysis. Many vendors offer cross-shopping analysis (or you can create the analysis yourself) or behavioral segments. These types of analyses can allow you to gain a deeper understanding of your customers and, more critically, how your customers differ from your competitors’ customers.
Conclusion
Human Movement Data can be an incredibly powerful tool to gain insights into your customers vs. visitors to your competitors. The knowledge gained through an analysis like this can lead to improved marketing spend, merchandising decisions, and operational strategies, giving you a true leg up on the competition.