Case Study to explore visitation patterns and characteristics of those seen at tourist attraction on the day of a major event

Background and Details
-png.png)
Use Case Questions
Reports used:
- Pathing X
- Common Evening Location - Common Daytime Location Distance
- Demographics
- Pin
- Audience Affinity
- Location Affinity
Where were devices observed inside the area of interest during the event?
The Pin Report reveals visitation patterns within a location. Using this report on the area of interest, we are able to see where devices are going and congregating.
-png.png)
Most of the activity was coming from along 10th Street, which is the street where the event had their main entrance. Also, the Meeting Area and Main Stage attracted many of the devices that were seen inside the tourist attraction on the day of the event.
What were devices doing before and after their arrival at the attraction?
The Pathing X Report provides all the points a device was seen before and after visiting a specific location. Using this report, we are able to see what devices are up to prior to their visit to the location and where they went their after their departure.
-png.png)
Many of the devices that were seen at the event congregated around the park in Midtown Atlanta prior to their visit.
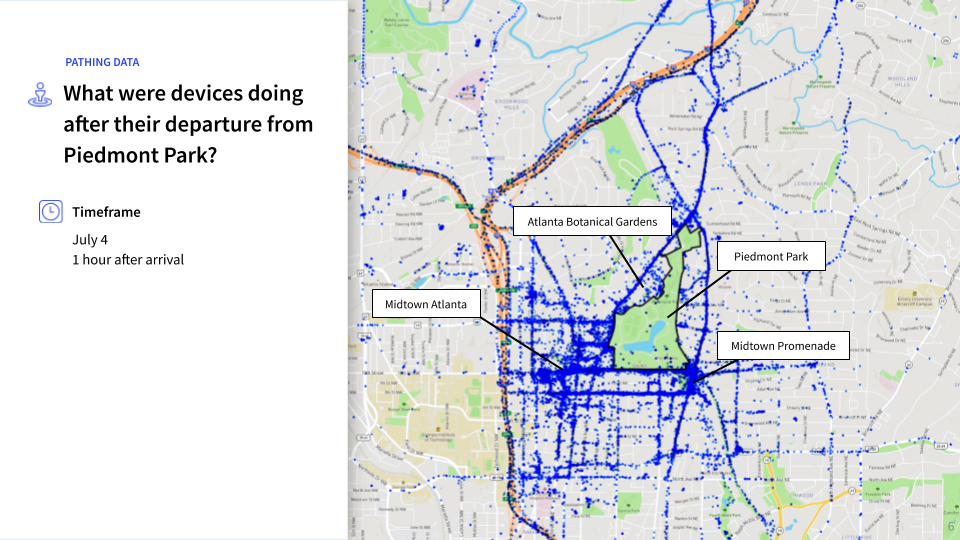
After leaving the event, many devices were still seen hanging out around the area. Such popular locales that were visited include Midtown Promenade, Midtown Atlanta, and the Atlanta Botanical Gardens.
When did these devices first appear?
-png.png)
A question like this could be answered using a Zero Point or Pin Report by looking at the first observation a device was seen inside the location and grabbing that timestamp. Majority of the devices first arrived at the location early in the morning from 7-11AM since the event starts at 6:25AM and ends at 11:30AM. Traffic significantly decreased after the conclusion of the event.
What are the Common Evening Locations of these devices?
The Common Evening Location - Common Daytime Location Distance Report allows a user to visualize and understand the origin markets of visitors to a location.
-png.png)
Over 60% of devices had a Common Evening Location within 25 miles of Piedmont Park, which make up the main audience for this event. However, devices as far as California and New York were also seen at this location for this occasion due to the prestige that this event holds.
What are the demographics of these devices?

Using the Demographics Report, we can understand some of the characteristics of the devices seen in this location. For example, the average household of these devices had a higher median household income of $75,773 and a high proportion of Caucasians.
To what brands do these devices have high affinity with?
Location Affinity Report ranks the likelihood that your customers would or would not visit certain brands or categories based on their location histories.
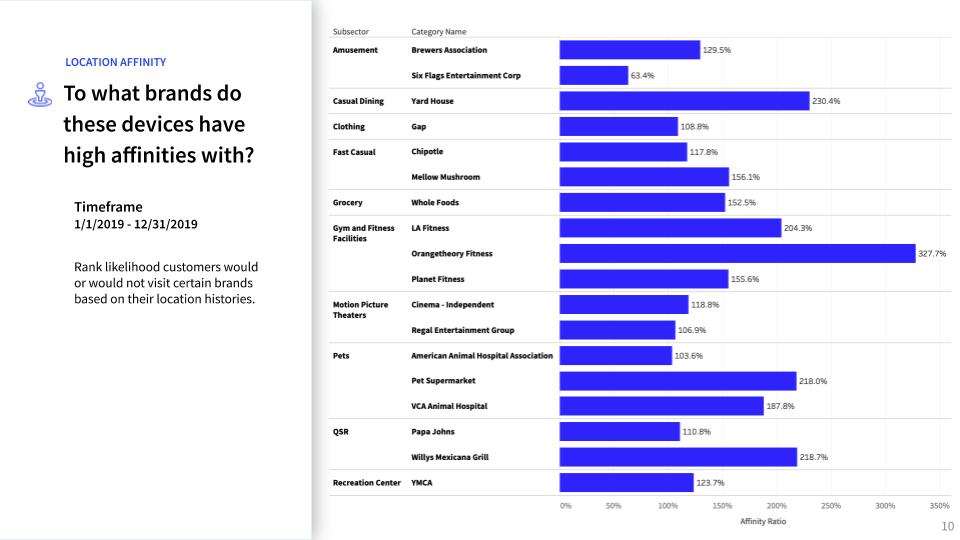
These devices had a high affinity towards fitness facilities like LA Fitness and Orangetheory and pet services like VCA Animal Hospital. They also enjoy eating out at fast casual or QSR spots like Papa Johns and Chipotle.
Which audiences do these devices fall within?
Audience Affinity report reveals the likelihood that your customers would or would not be members of certain audience segments based on our comprehensive audience parameters.

Similar to what the Location Affinity report revealed, the top audiences that these devices fell within involved a love for QSR, fast casual restaurants, and pets.
What Actionable Insights Did the Client Gather from this Case study?
Using the data and insights provided by the above analysis, the client was able to understand the visitors of their event. Whether it was to determine where they went to before/after the event, their origin markets, or their shopping preferences, the insights were valuable in creating an event-goer profile. With this knowledge, the client was able to focus marketing efforts towards attracting their target audiences and help the city prepare for an influx of visitors to specific locations. Near data can be used not only for specific festivals but can also be used for other events such as busy holiday weekends. This is just one of many examples that highlight the power of Human Movement Data to guide decisions.
Insights provided by Near in this study are aggregated and de-identified, not tied to any single device or individual. Near adheres to GDPR and CCPA and has been certified for privacy compliance by Verasafe, an independent third party.
About the Author
Grant is an expert in data science and statistics. He cares about translating data to create actionable insights, and wants to help you do the same.